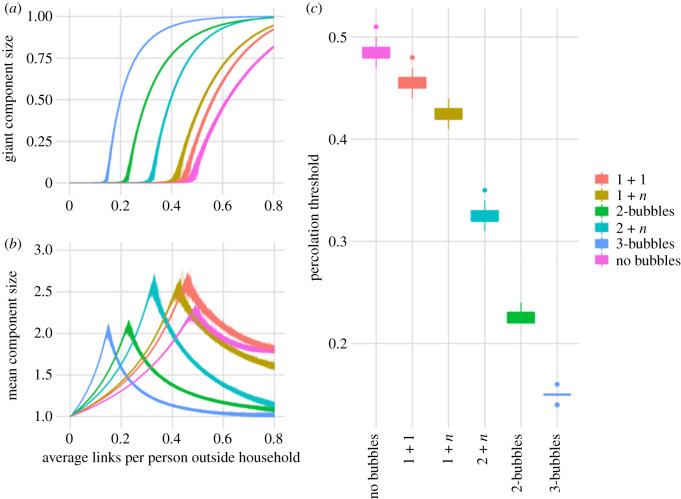
Figure 2.
Percolation analysis for hypothetical bubbling scenarios. (a) The proportion of households connected to the giant component. (b) The average size of components not connected to the giant component (order parameter) for the same bubbling strategies. (c) The percolation threshold for the different bubbling assumptions.

