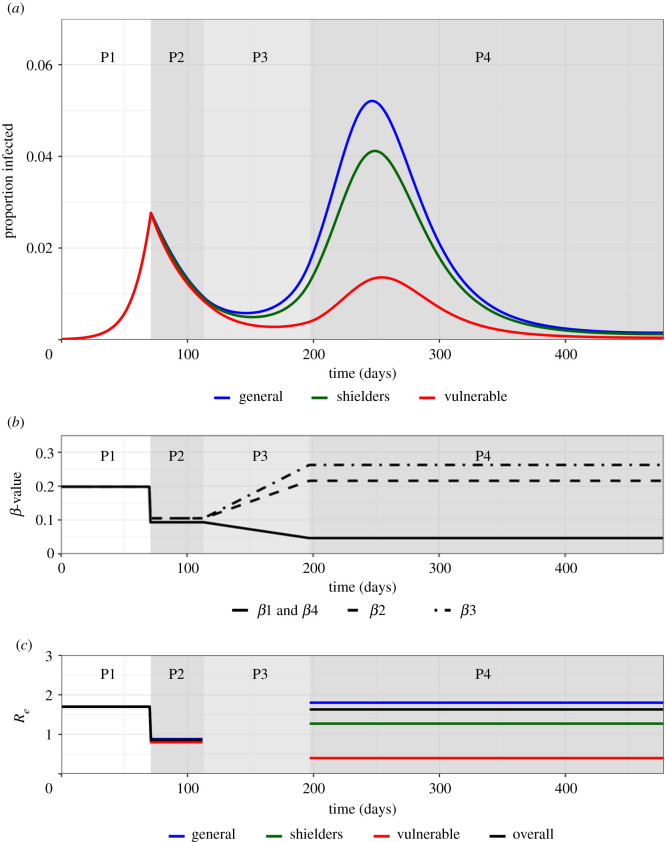
Figure 2.
Trajectory plots for the proportion infected in the vulnerable, shielders and general populations, with accompanying β and Re plots for the baseline scenario. Phases 1–4 are indicated. (a) Trajectory plots of the proportion of those infected in the vulnerable (green), shielders (red) and general (blue) populations, shading depicts the different phases of enhanced shielding intervention. (b) Values for the different β over the course of the simulation as they are implemented for the different intervention phases. In short, β1: transmission among and between vulnerable and shielders; β2: transmission between shielders and general population; β3: transmission between general population; β4: transmission between vulnerable and general population (see table 1 for full WAIFW matrix). (c) Values of the corresponding Re values (colours) for the different subpopulations and the overall Re (black) during the different intervention phases. (See the electronic supplementary material, Information for calculation of overall Re). (Online version in colour.)

