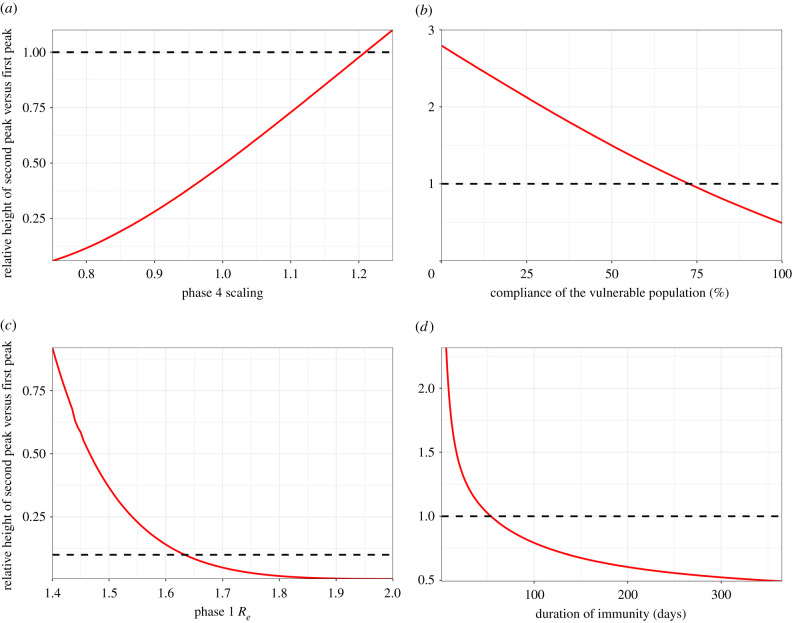
Figure 3.
Sensitivity analyses. Plots show the relative height of the second peak versus the first peak Iv as a function of relevant parameter value. Dotted lines represent peaks of equal height. (a) Relative values of Re in P3/P4. The second peak is higher for a relative value greater than 1.22, corresponding to Re > 1.99. (b) Adherence in P3/P4. 100% adherence equates to P4 (baseline value); 0% adherence equates to a pre-lockdown value of . The second peak is higher for adherence less than 74%. (c) Re in all phases. P1 Re values are shown; Re values in other phases are scaled accordingly. The second peak is higher for P1 Re < 1.63. (d) Duration of immunity (expressed as 1/ζ). The second peak is higher for 1/ζ < 54 days.

