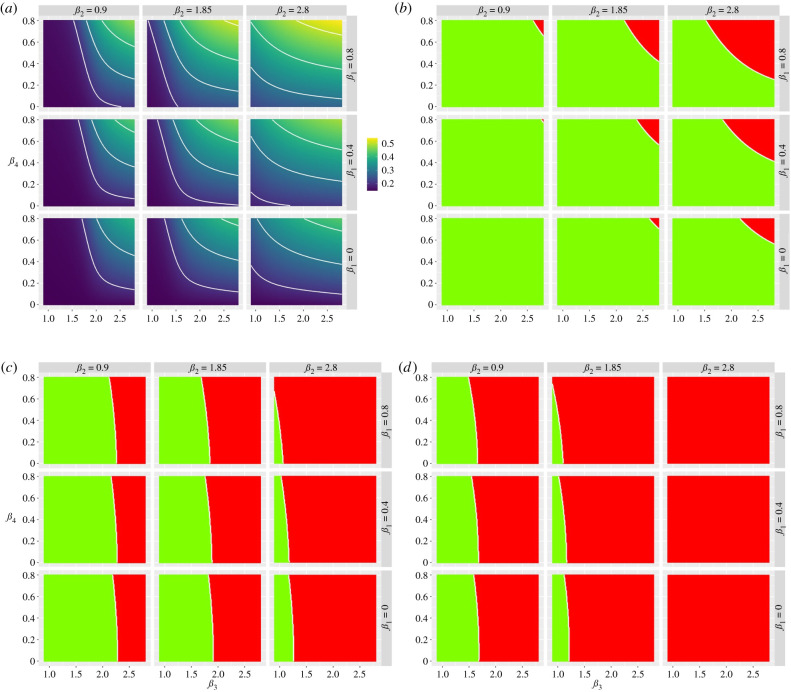
Figure 5.
Heat maps showing the trade-off between relaxation (left to right on the horizontal axis) and increasing protection (top to bottom on the vertical axis). (a) Heat maps describing the cumulative infected vulnerable fraction (Iv) 1 year after the start of lockdown for different combinations of β3 and β4 for different values of β1 (rows) and β2 (columns). (b) As (a) but for whether the second peak of Iv is lower (green) or higher (red) than the first peak. (c) As (b) but all second peaks (Iv, Is, Ig) smaller than first peaks (green). (d) As (b) but dI/dt is negative or zero for at least 1 year after the start of lockdown for all I-compartments. (Online version in colour.)

