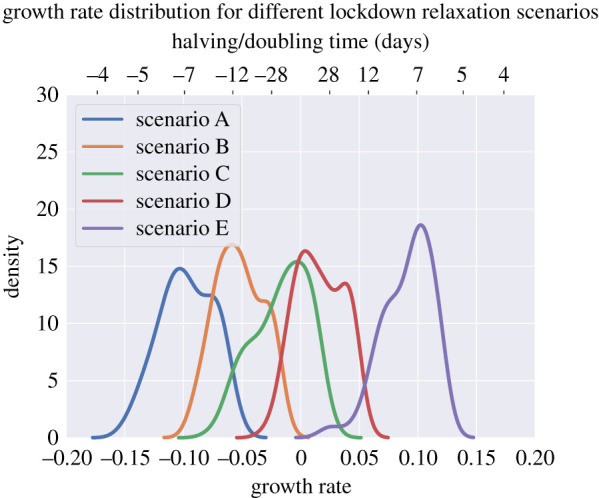
Figure 7.

Distributions of epidemic growth rates under the different lockdown relaxation scenarios. Scenarios are as described in tables 4 and 5, with scenario A on one extreme representing a small increase in school and workplace contacts, and scenario E on the other extreme representing a larger increase in work contacts, as well as resumption of school contacts and resumption of most leisure contacts. Negative values on the doubling time axis imply a halving time. (Online version in colour.)
