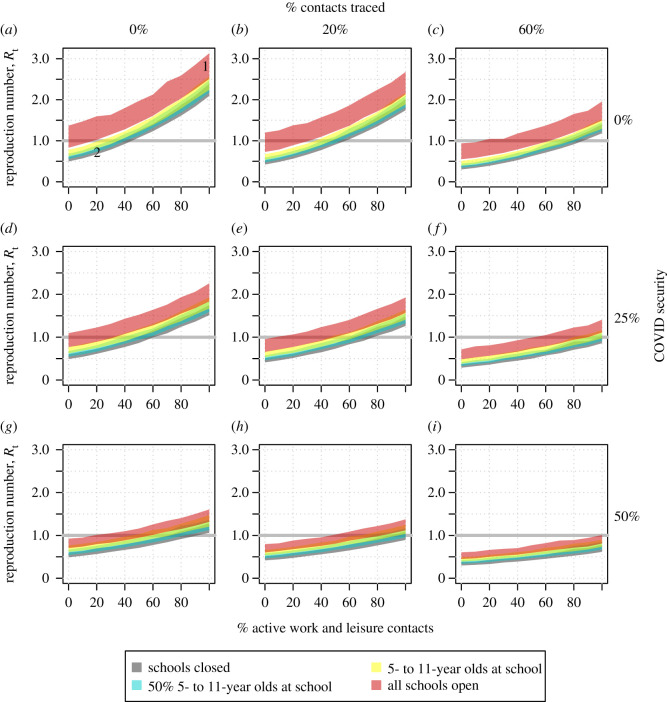
Figure 3.
The COVID-19 R number as a function of the percentage of active work and leisure contacts under different contact tracing, COVID security and school closure scenarios. The shaded regions indicate the values with schools closed (grey, bottom ribbons), 50% of primary school pupils attending school (cyan), all primary school pupils at school (yellow) and primary and secondary schools open (red, top ribbons). The panels illustrate the values of the R number with (a) no contact tracing or COVID security and with increasing measures (b–i). The number 1 marks the UK position in March 2020, number 2 marks the UK position in April/May 2020. The width of the ribbons indicates 95% confidence intervals. These figures are generated with the assumption that children under 11 years of age are as infectious as adults. (Online version in colour.)

