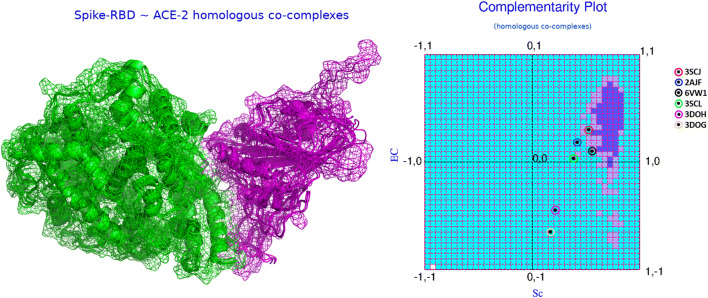
Fig. 2.
The dynamics of RBDSpike–ACE2 binding from complementarity estimates. The left panel of the figure shows the superposed RBDSpike–ACE2 binary complexes from the homologs (see the “Evolution of the CoV-2 RBDSpike–ACE2 interaction dynamics” section) in cartoon covered with mesh representation. The receptors and the ligands are colored in green and magenta, respectively. The right panel shows the mapping of their corresponding {Sc, EC} points in CPdock as per mentioned in the embedded legend

