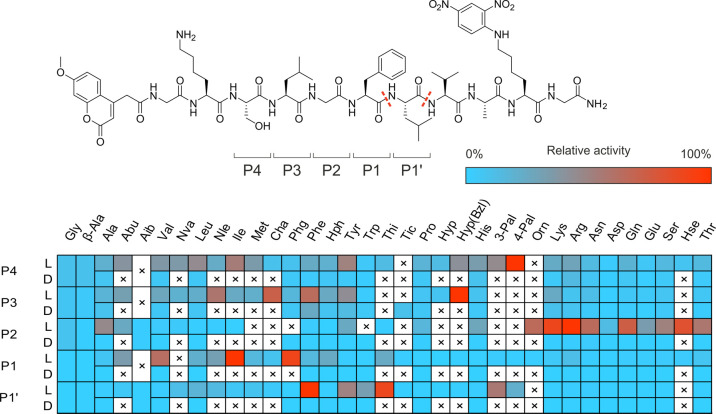
Figure 3.
Substrate specificity profile of May1 at the P4–P1′ positions presented as a heat map. L and D rows indicate the amino acid enantiomer at a given position. Dashed lines indicate substrate cleavage sites detected by LC–MS, with the most abundant N-proximal Phe*Leu site selected as a residue numbering reference.

