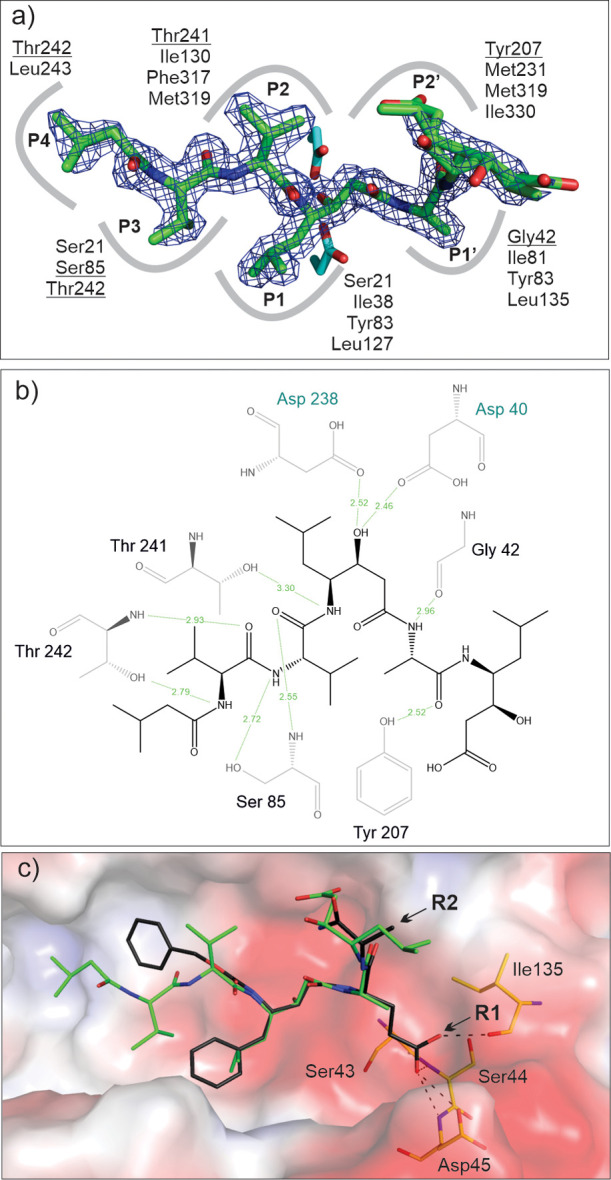
Figure 5.

PepA binding to May1 (PDB 6R6A). (a) Top view of the binding pose of PepA in the May1 active site. The 2Fo-Fc map (contoured at 1.5σ) is shown in blue; catalytic aspartates (sticks with carbons colored cyan) interact with the central statine residue. Residues contributing to PepA binding in the S4–S3 subsites are indicated; those forming polar interactions are underlined. (b) Ligand–protein interaction diagram of the May1–PepA complex generated by LigPlot.49 Residues engaged in polar ligand interactions (green dashed lines) are shown; numbers represent distances between hydrogen bond donor and acceptor in Å. (c) Model of N-terminally carboxybenzylated phenylstatine superimposed with PepA. Points of attachment for the R1 and R2 substituents are indicated by arrows. The protein is represented by its solvent accessible surface area colored by electrostatic potential (red for negative, blue for positive). Residues available to form polar interactions with the P1′ substituent are shown as sticks and labeled, and possible interactions are indicated by dashed lines.
