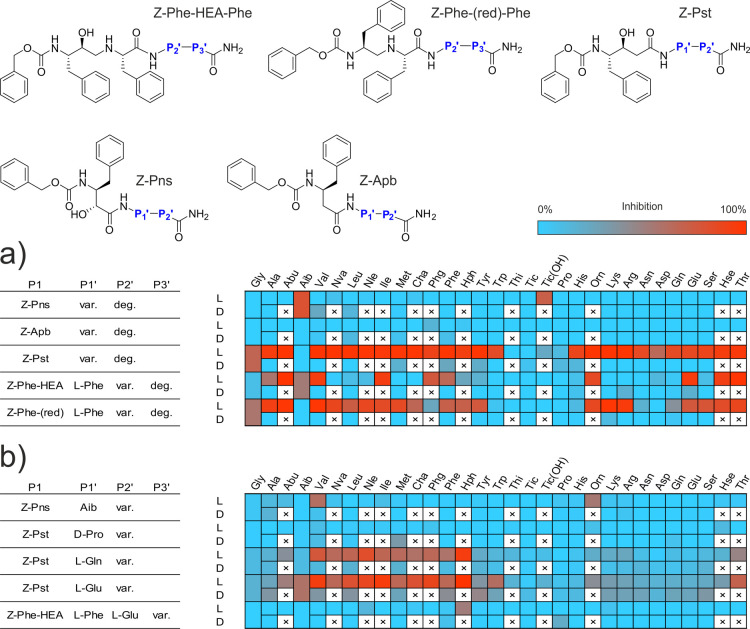
Figure 6.
Linear statin inhibitor structures and residue preference heatmaps. L and D rows indicate the amino acid enantiomer at a given position. (a) Initial screening of the N-proximal site with a degenerate C-terminal residue. A final concentration of 500 nM per individual compound was used in library screening. (b) Deconvolution of selected libraries with favorable N-proximal residues based on initial screening. Single-compound deconvolution experiments were conducted with a 1 μM final concentration of the test compound.

