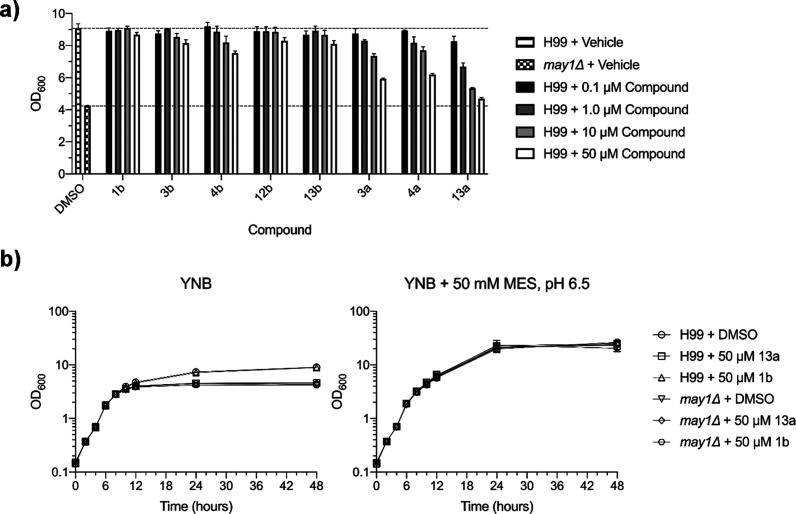
Figure 7.
Evaluation of May1 inhibitor activity against cultured C. neoformans yeast. (a) Terminal saturation densities of yeast cultured for 48 h in YNB minimal medium containing May1 inhibitors or a 0.5% DMSO vehicle. Dashed lines represent terminal OD600’s of the DMSO-treated H99 and may1Δ controls. Error bars represent standard deviation of the mean from triplicate cultures. (b) Growth curves of H99 and may1Δ yeast treated with lead compound 13a, negative control compound 1b, or a 0.5% DMSO vehicle control in either standard YNB medium (left) or YNB medium buffered to pH 6.5 (right). Error bars represent standard deviation of the mean from triplicate cultures.

