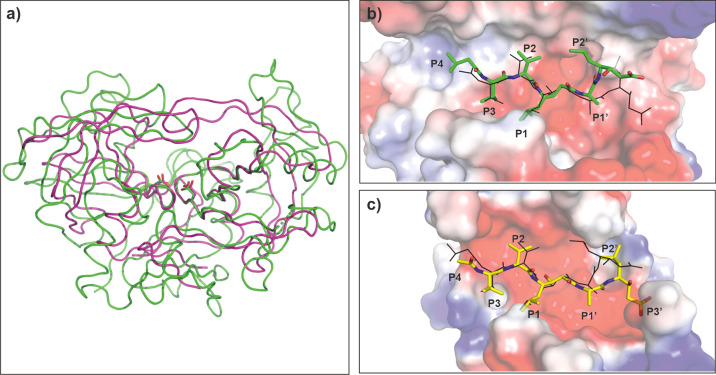
Figure 8.
Comparison of May1 (PDB code 6R5H) with HIV-1 Pr (PDB code 2hvp(62)). (a) Overall superposition of May1 (green) with HIV-1 Pr (maroon). Catalytic aspartates are highlighted in stick representation. (b) Top view into the May1 active site. The protein is represented by the solvent accessible surface area colored by electrostatic potential; PepA is represented as sticks with carbon atoms colored green; the inhibitor pose in HIV-1 Pr is shown with black lines. (c) Top view into the HIV-1 Pr active site. The protein is represented by solvent accessible surface area colored by electrostatic potential; acetyl-pepstatin is represented as sticks with carbon atoms colored yellow; the PepA pose in May1 is shown with black lines. In b and c, flap regions covering the active site are omitted for clarity.

