
Figure 2.
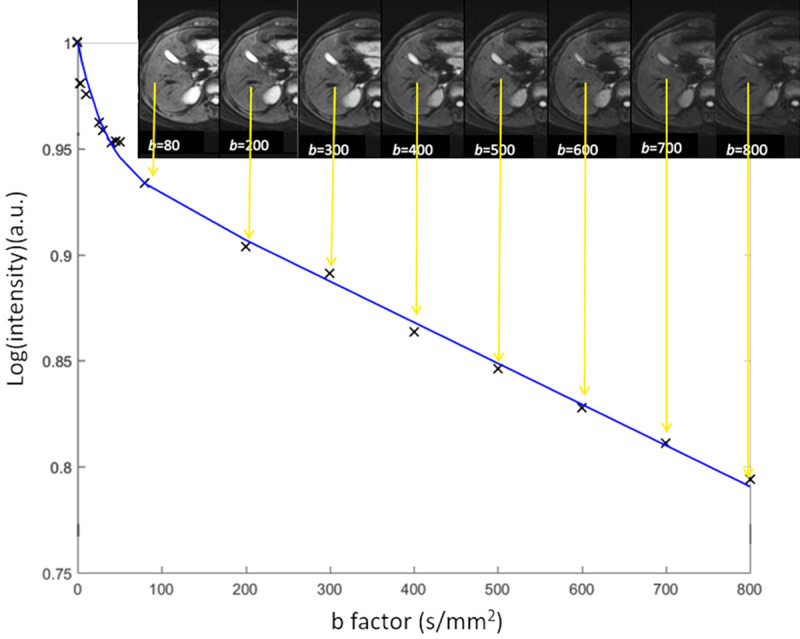
A simplified scheme shows diffusion-weighted imaging ADC calculation with various b-values. For each image voxel (or region-of-interest) acquired at same anatomic position at increasing b value, logarithm of relative signal intensity is plotted against b-values. Slope of line (monoexponential fit) is ADC of that image voxel (or region-of-interest). Note that gallbladder cyst also shows high signal on most of b-value images due to relatively long T2 relaxation time. This is the phenomenon known as “T2-shine through”.