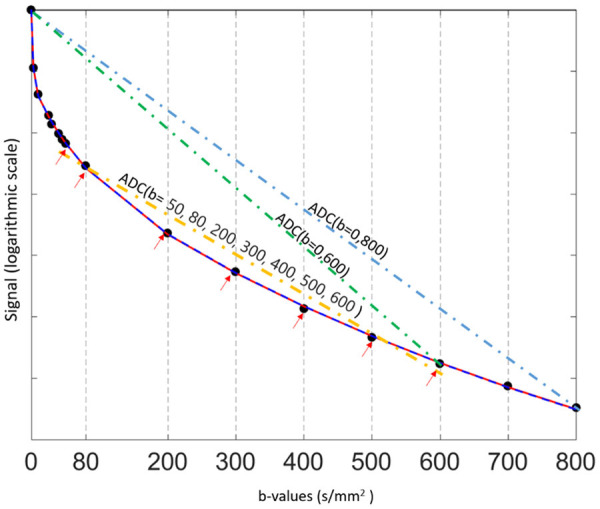
Figure 3.

Relationship between diffusion-weighted signal and b-values ( 0, 3, 10, 25, 30, 40, 45, 50, 80, 200, 300, 400, 500, 600, 700, and 800 s/mm2) in a normal liver. In a semi-logarithmic projection, a mono-exponential curve gives a straight line, whose slope is ADC. The first part (0 < b < 50 s/mm2) of the fitting curve represents both diffusion and perfusion, whereas the second part (> 50 s/mm2) reflects mostly diffusion. The ADC (i.e. the slope) varies considerably (and is overestimated) when b = 0 s/mm2 is used to calculate it. In this example, ADC (b = 0, 600) > ADC (b = 0, 800) > ADC (b = 50, 80, 200, 300, 400, 500, 600).
