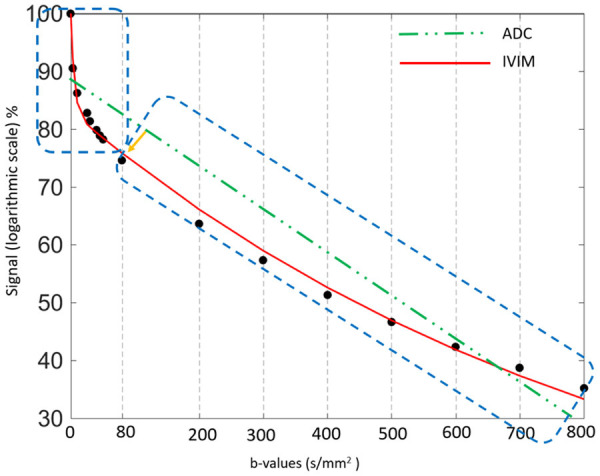
Figure 6.

Plots show logarithm of relative signal intensity vs. b-values from normal liver parenchyma. There is an initially steeper decrease in plotted signal values at low b-values which represents substantial perfusion component, and a more gradual attenuation of signal at higher b-values which mainly represent diffusion component. Using simple monoexponential apparent diffusion coefficient (ADC) line fitted to data (dotted green line) provides suboptimal characterization of signal attenuation behaviour. IVIM: Intravoxel incoherent motion.
