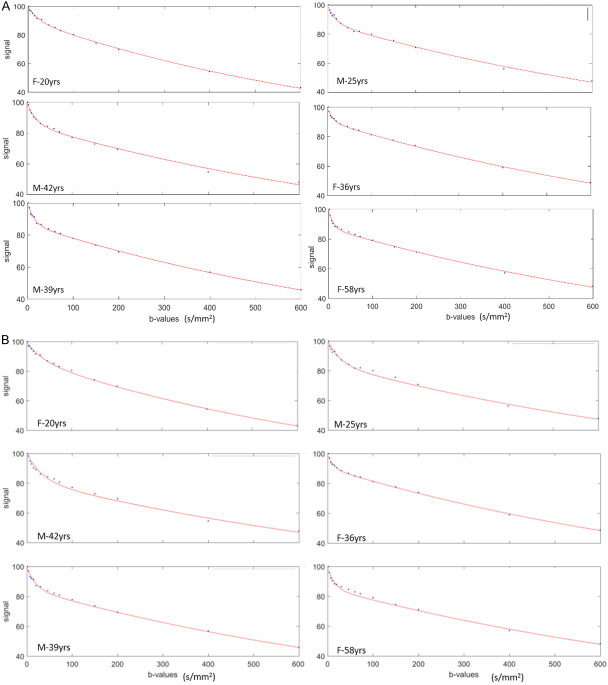
Figure 7.
IVIM signal bi-exponential decay curve is better fitted with threshold b-value of 60 s/mm2 than with threshold b-value of 200 s/mm2. (A) Six consecutive healthy participants’ liver IVIM bi-exponential segmented fitting curves with threshold b value of 60 s/mm2, all demonstrating very good fitting. (B) The same six study participants’ IVIM bi-exponential segmented fitting curves with threshold b-value of 200 s/mm2. Compared with (A), it can be visually noted that the fittings in (B) are less optimal. Data include 15 b-values of 2, 4, 7, 10, 15, 20, 30, 46, 60, 72, 100, 150, 200, 400, 600 s/mm2, and fitting starts from b = 2 s/mm2 image. M: male; F: females. [Reproduced with permission from reference [69]].

