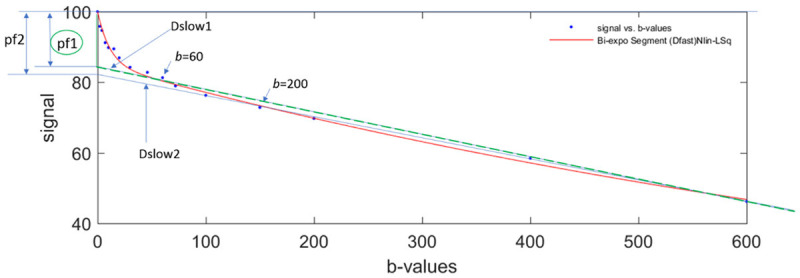
Figure 10.

Bi-exponential segmented fitting curve of parenchyma in a healthy liver. The b-value distribution is 0, 2, 4, 7, 10, 15, 20, 30, 46, 60, 72, 100, 150, 200, 400, 600 s/mm2, and fitting starts from b = 0 image. When a higher threshold b-value (such as b = 200 s/mm2) is used, the Dslow value (slope of blue Dslow2 line) will be smaller than when a lower threshold b-value (such as b = 60 s/mm2) is selected (slope of green Dslow1 line). On the other hand, the computed PF is larger when a higher threshold b-value is used (height of pf2) than when a lower threshold b-value is used (height of pf1).
