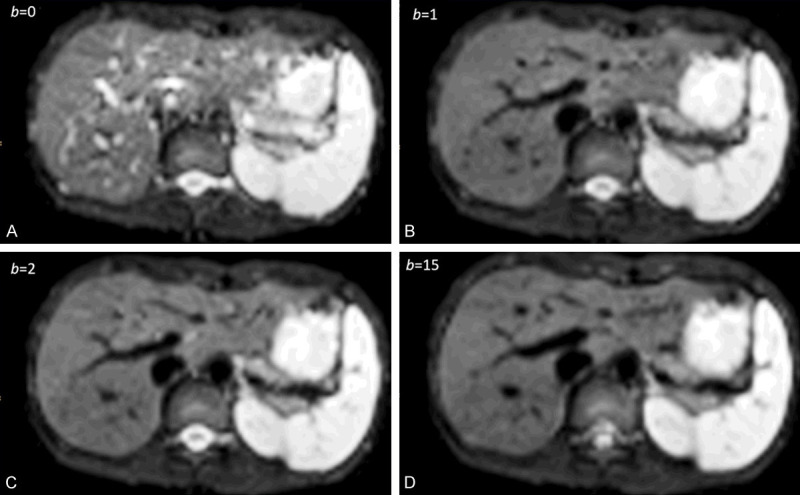
Figure 11.

1.5T liver IVIM diffusion images with b-value = 0, 1, 2, 15 s/mm2. The signal difference between b = 0 s/mm2 image and b = 1 or 2 s/mm2 images is dramatic, particularly the vessels show high signal without diffusion gradient while showing dark signal when the diffusion gradient is on even at b = 1 s/mm2. [Reproduced with permission from reference [72]].
