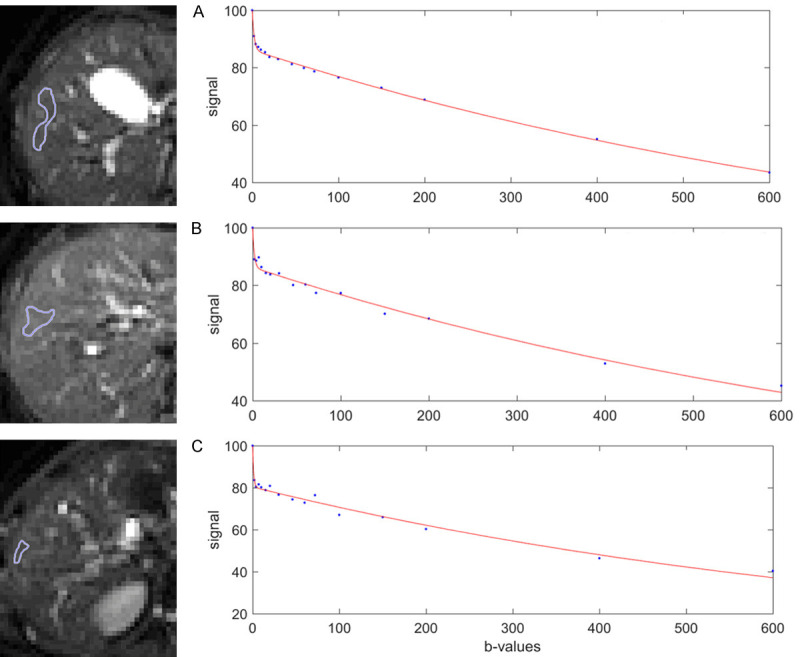
Figure 12.

Bi-exponential full fitting curves of three portions of liver parenchyma from three healthy livers. On b = 0 images, small ROIs are drawn on liver parenchyma excluding bright pixels which would contain ‘visible’ vessel. The b-value distribution is 0, 2, 4, 7, 10, 15, 20, 30, 46, 60, 72, 100, 150, 200, 400, 600 s/mm2, and fitting starts from b = 0 image. Note despite the ROIs do not contain visible vessel, a steep drop of signal from b = 0 to b = 2 can still be seen, this would be caused by sub-pixel micro-vessels which show high signal on b = 0 image while low signal on b = 2 image. [Reproduced with permission from reference [6]].
