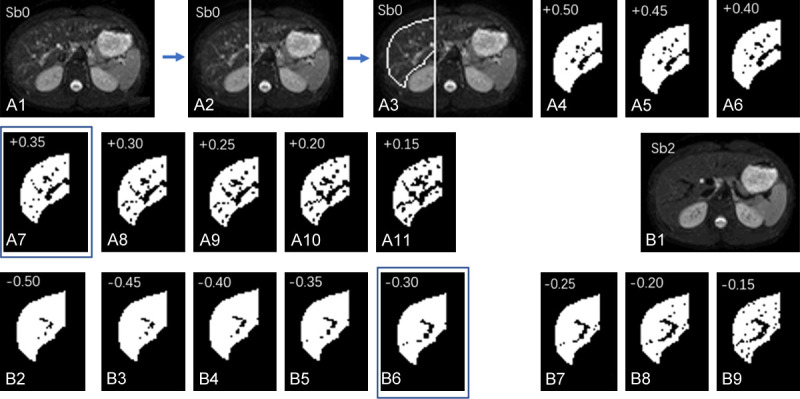
Figure 14.

An example of ‘vessel-pixel-removal’ postprocessing of Sb0 image (b-value = 0 s/mm2) and Sb2 image (b-value = 2 s/mm2). (A1) The original Sb0 image. (A2) A vertical line is drawn along the right border of vertebral body, the liver left to this line is excluded from analysis; (A3) The liver right to the vertical line is segmented manually, resulting in an area0. (A3) The pixels with signal 50% higher than the mean signal of segmented liver is tentatively excluded; (A4) The pixels with signal 45% higher than the mean signal of segmented liver is tentatively excluded. (A5-A11) follow the same rule as (A3 and A4). (A7) With the pixels of signal 35% higher than the mean signal excluded shows best results (compromise) in removing ‘bright’ vessel pixels in this case. (A8-A11) are considered to have too much ‘over-kill’. (B1) The original Sb2 image; (B2) The right liver is segmented similarly to (A3), resulting in an area2, and the pixels with signal 50% lower than the mean signal of segmented liver is excluded. (B3-B9) follow the same rule as (B2). (B6) With the pixels of signal 30% lower than the mean signal of segmented liver excluded show best results (compromise) in removing ‘signal-void ‘vessel pixels’ for this case. (B7-B9) are considered to have too much ‘over-kill’. [Reproduced with permission from reference [79]].
