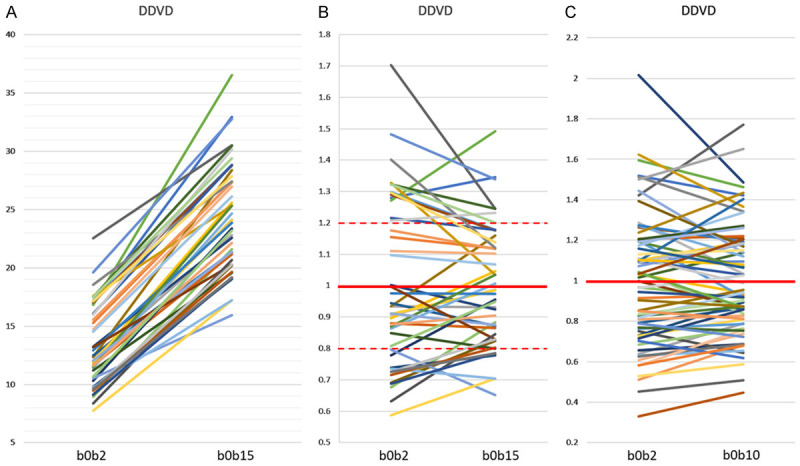
Figure 16.

Correlations between DDVD (b0b2) vs. DDVD (b0b15) and DDVD (b0b2) vs. DDVD (b0b10). Hereby b0b2, b0b10, and b0b15 refer to the signal differences between b = 0 image and b = 2 s/mm2 image, between b = 0 image and b = 10 s/mm2 image, and between b = 0 image and b = 15 s/mm2 image, respectively. (A and B) are with data from reference 79 containing both healthy livers and fibrotic livers. (C) is with data from reference 69 containing only healthy livers. One line represents one study subject. As expected, DDVD (b0b15) values are all higher than DDVD (b0b2) values (A). In (B and C), the means of DDVD (b0b2) values and DDVD (b0b15, or b0b10) values are taken as 1, and individual values are normalised with the mean value. (B) shows, for those with DDVD (b0b2) value above 1, the corresponding DDVD (b0b15) values are also mostly above 1. For those with DDVD (b0b2) value between 1~0.8. the corresponding DDVD (b0b15) values are also mostly between 1~0.8. (C) shows the similar trend as in (B). (B and C) show DDVD (b0b15) or DDVD (b0b10) values are less scattered than DDVD (b0b2) values. [Original data from references [69,79], reproduced with permission].
