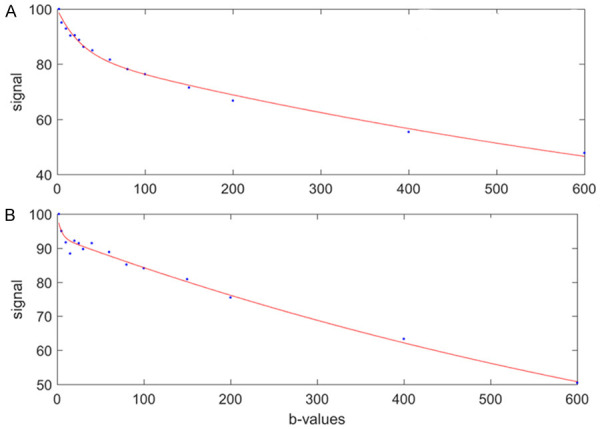
Figure 17.

Bi-exponential segmented fitting curves of two liver IVIM scans with ROI (region-of-interest) based analysis. The b-value distribution is 2, 5, 10, 15, 20, 25, 30, 40, 60, 80, 100, 150, 200, 400, and 600 s/mm2, and fitting starts from b = 2 image. (A) represents a good fit and (B) represents an unacceptable fit that does not provide reliable measure. [Reproduced with permission from reference [6]].
