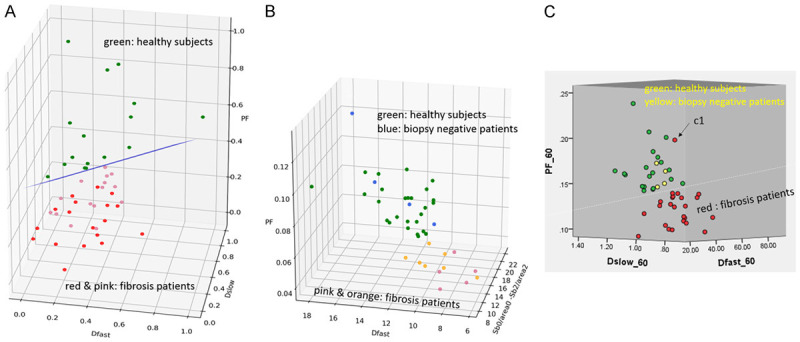
Figure 21.

IVIM parameter three-dimensional plot of three studies by (A) Wang et al. [84], (B) Xiao et al. [79], and Li et al. (C) [80]. All modified with permission. The initial plot of Wang et al. in [84] has been re-drawn. (A) Green dots, liver of healthy volunteers; pink dot: stage-1/2 fibrotic livers; red dot: stage-3/4 fibrotic livers; (B) Green dot, liver of healthy volunteers; blue dots: 1 patient with mild simple steatosis and 3 viral hepatitis-b patients without liver fibrosis; orange dots: stage-1/2 patients; pink dots: stage-3/4 patients. (C) Green dot, liver of healthy volunteers; yellow dot: viral hepatitis-B patients without fibrosis; red dot: fibrotic livers.
