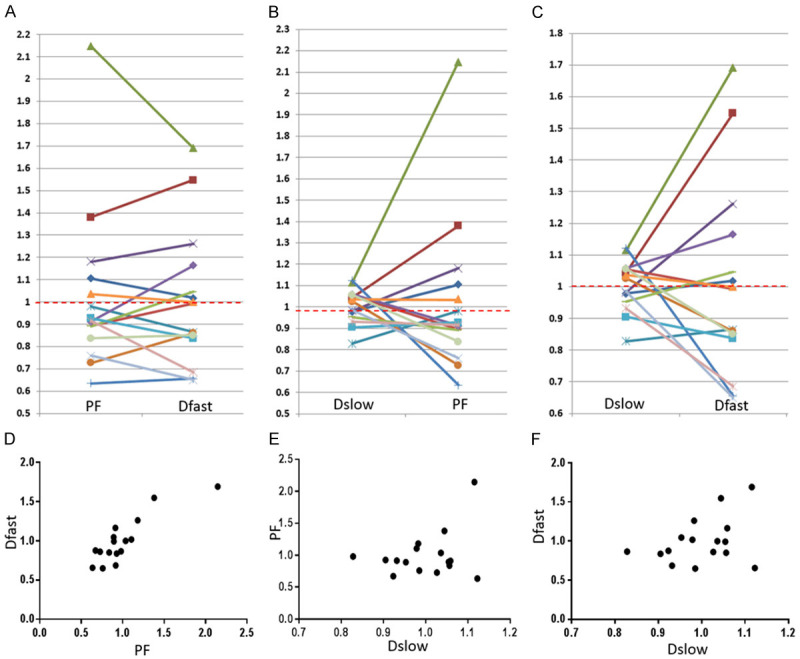
Figure 24.

Graphical demonstration of the correlations among PF, Dfast, and Dslow. The mean measures of PF, Dslow, and Dfast for 16 patients are re-scaled to be 1. Each line or dot represents one study subject. Most of the PF measurements smaller than 1 are associated with Dfast smaller than 1, and vice versa. The lowest PF measurement is associated with the lowest Dfast measurement, and highest three PF measurements are associated with the highest three Dfast measurements (A, D). On the other hand, the associations between Dslow vs. PF or between Dslow vs. Dfast are scattered (B, C, E, F). A number of Dslow measurements larger than 1 are associated with PF or Dfast measurements smaller than 1. Pearson correlation coefficient r was 0.865 (P < 0.001) for PF vs. Dfast (not significant for Dslow vs. PF and Dslow vs. Dfast). [Reproduced with permission from reference 83]].
