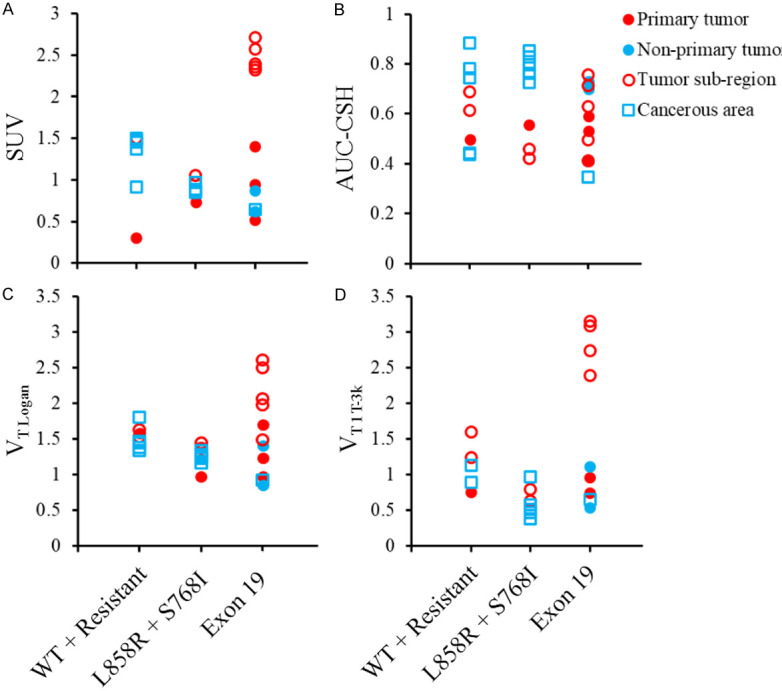
Figure 2.

SUV (A), AUC-CSH (B), VT Logan (C), and VT 1T-3k (D) plotted by tumor biology and lesion type. Results were combined across all subjects. Values were similar within subjects but not across them. No associations were identified between endpoints and mutation status or lesion type.
