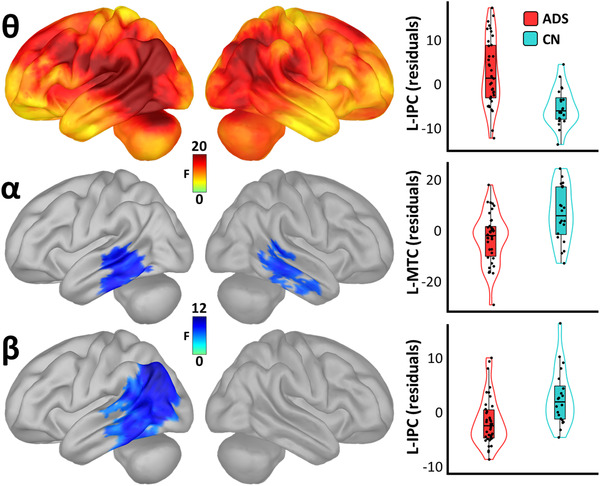
FIGURE 2.

Spatio‐spectral group differences in cortical neural oscillatory amplitude. Surface maps to the left indicate significant statistical differences in oscillatory amplitude between patients (Alzheimer's disease spectrum [ADS]) and cognitively normal older controls (CN), beyond the effects of age, and corrected for multiple comparisons using a stringent threshold‐free cluster enhancement approach (pFWE = .05). Theta maps are shown at the top, with alpha maps in the middle and beta maps at the bottom. Plots to the right of each map indicate the direction and nature of these effects at the vertices where they were most pronounced. Box plots represent conditional means, first and third quartiles, and minima and maxima, and violin plots show the probability density. L‐IPC, left inferior parietal cortex; L‐MTC, left middle temporal cortex
