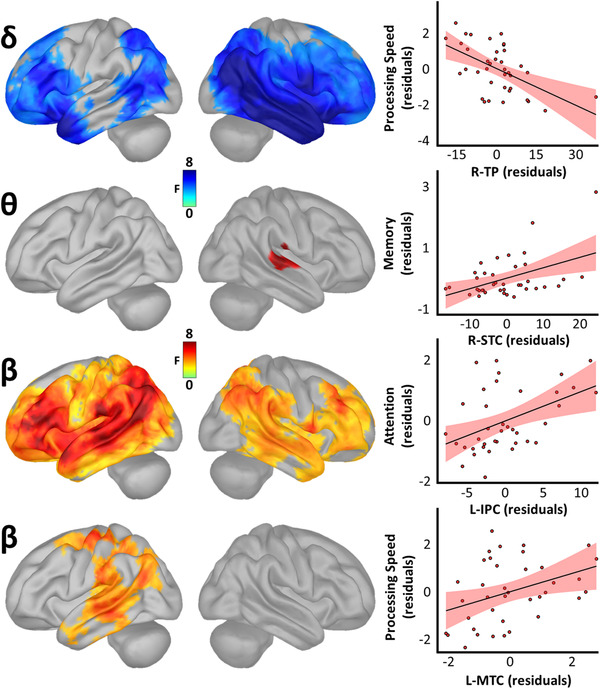
FIGURE 3.

Spatio‐spectral neural oscillations predict cognitive decline along the Alzheimer's disease (AD) spectrum. Surface maps to the left indicate significant statistical outputs of whole‐brain models relating oscillatory amplitude and domain‐specific cognitive function in patients on the AD spectrum, beyond the effects of age, and corrected for multiple comparisons using a stringent threshold‐free cluster enhancement approach (pFWE = .05). Plots to the right of each map indicate the direction and nature of these effects at the vertices where they were most pronounced, with lines‐of‐best‐fit and corresponding confidence intervals overlaid. L‐IPC, left inferior parietal cortex; L‐MTC, left middle temporal cortex; R‐STC, right superior temporal cortex; R‐TP, right temporal pole
