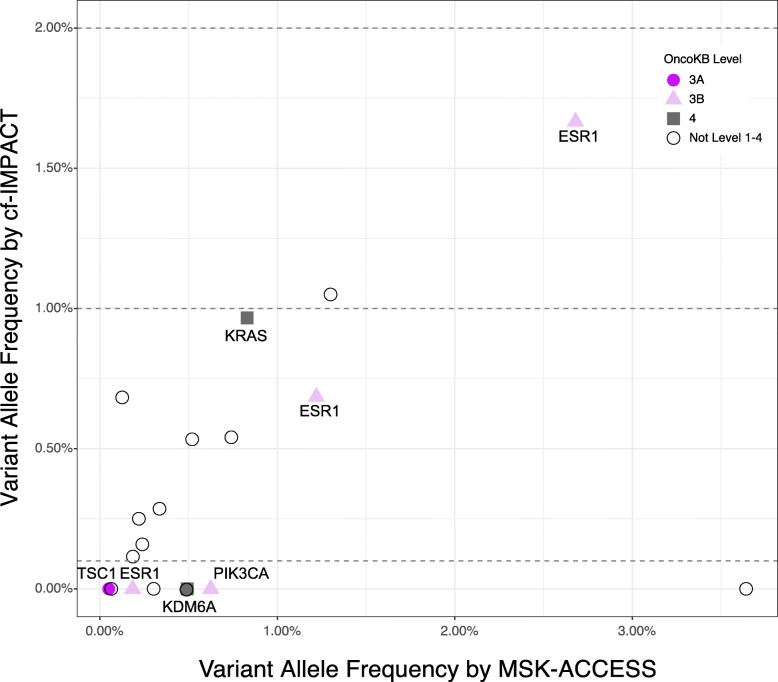
Fig. 5.
cfDNA tumor fraction guides the optimal selection of profiling assays. a MSK-ACCESS analysis of cfDNA samples with sWGS-estimated z-score <5 and no mutations detected by cf-IMPACT identified mutations at allele fractions below the detection limit of cf-IMPACT. Mutations with potential clinical relevance that were not detected by cf-IMPACT but were identified by MSK-ACCESS are highlighted. Retrospective manual curation of cf-IMPACT data guided by MSK-ACCESS results revealed evidence of a subset of mutations below the detection limit of cf-IMPACT. The dotted lines indicate the two different detection limits of cf-IMPACT: 1% for genotyping of mutation known from tumor profling and 2% for de novo calling of hotspot mutations. The colors of the shapes represent the corresponding OncoKB annotations (dark purple=level 3A, light purple=level 3B, gray=level 4, open = variants not listed on levels 1–4)

