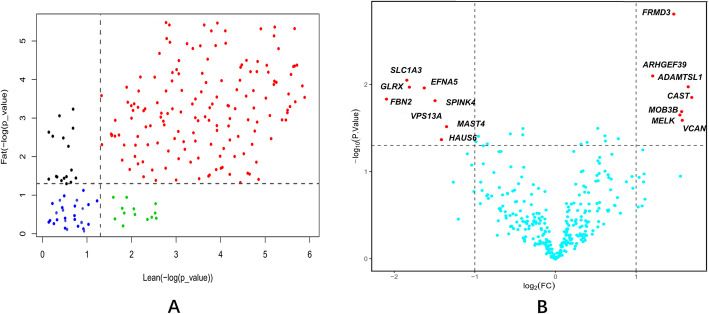
Fig. 3.
Candidate gene expression profiles in the adipose tissue of the NEAUHLF. The subgraph (a) is the gene expression profile of two chicken strains. The x-axis and y-axis is - log (P_value) of lean and fat line respectively, and the threshold value was p < 0.05. The red points indicate 155 genes that are expressed in the abdominal fat of both thin and fat lines, while the blue points indicate 28 genes that are not expressed in either line. The 13 green points indicate genes expressed in the lean line but not in the fat line and vice versa for the 19 black points.. The subgraph (b) shows the differential expression of genes in adipose tissues in fat and lean lines at the 7th week of age. The threshold is P < 0.05, fold change > 2. The red points indicate genes that are differentially expressed in the two chicken lines

