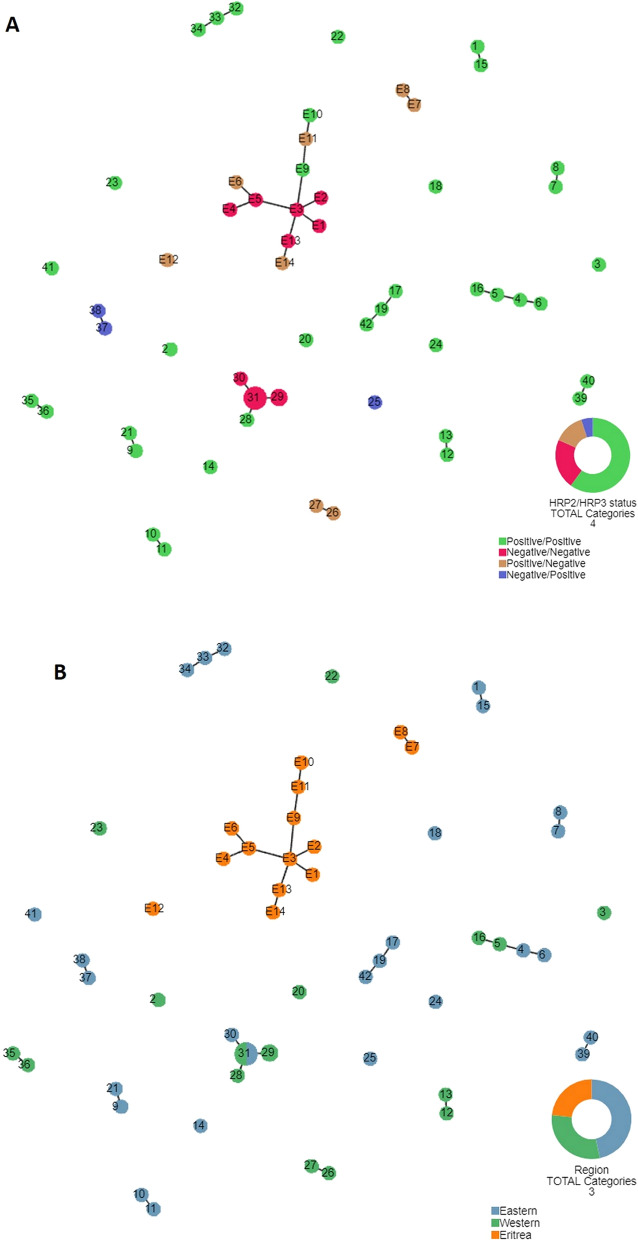
Fig. 2.
Genetic relatedness of P. falciparum populations. a and b Legend: Genetic relatedness of P. falciparum populations from Uganda differing in pfhrp2/3 genetic gene status (a) and comparison of parasite populations from Uganda and Eritrea (b). The relatedness among parasites was constructed using seven neutral microsatellite markers/loci indicated in Additional file 1: Table S1. Plots were produced using Phyloviz software at cutoff value of 3 minimum differences for 4 loci). Numbered circles indicate specific haplotypes. Circle sizes are proportional to the number of samples with a particular haplotype. The number of samples are indicated inside each circle. Pfhrp2/pfhrp3 status is indicated as: Positive/Positive (wild type), Negative/Negative (dual pfhrp2/3 deletion), Positive/Negative (pfhrp3 deletion) and Negative/Positive (Pfhrp2 deletion)

