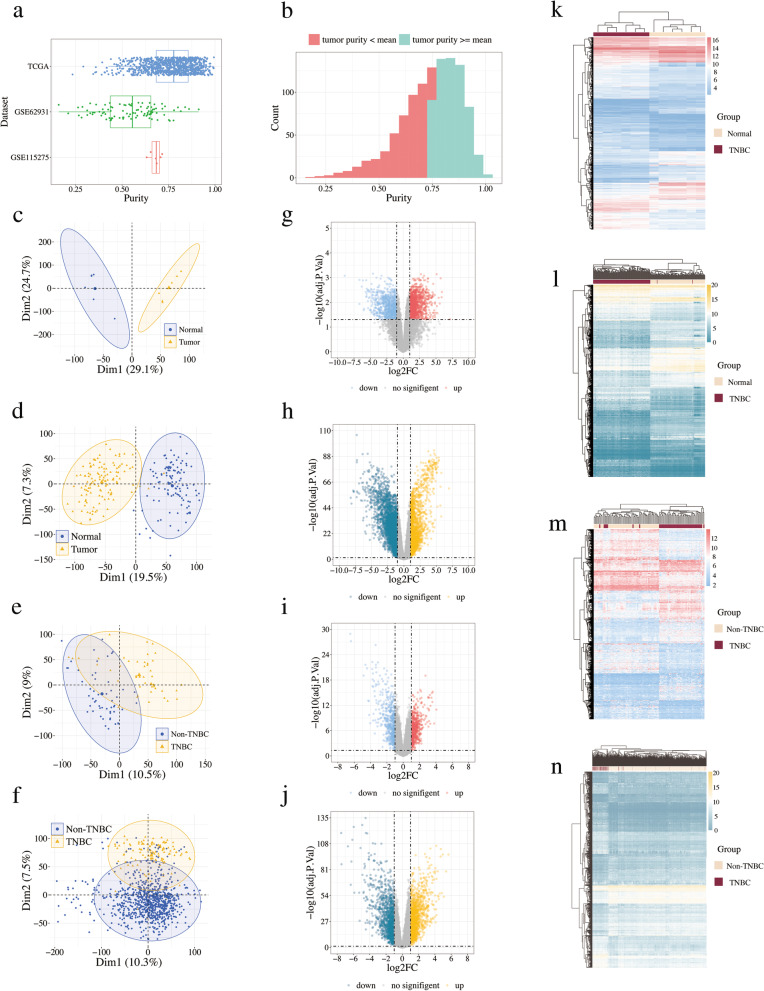
Fig. 2.
The results of DEGs analyses in GSE62931, GSE115275 and TCGA cohort. a Boxplot of tumor purity in TCGA, GES115275 and GES62931. b Histograms of tissues’ tumor purity. PCA plot of c GSE115275, d normal and TNBC samples from TCGA, e GSE62931, f non-TNBC and TNBC samples from TCGA. Volcano plot of g GSE115275, h normal and TNBC samples from TCGA, (i) GSE62931, (j) non-TNBC and TNBC samples from TCGA. Upregulated genes and downregulated genes are represented by red and blue dots in the volcano map, however, the genes having no obvious difference are represented by gray. Heatmap of (k) GSE115275, (l) normal and TNBC samples from TCGA, (m) GSE62931, (n) non-TNBC and TNBC samples from TCGA

