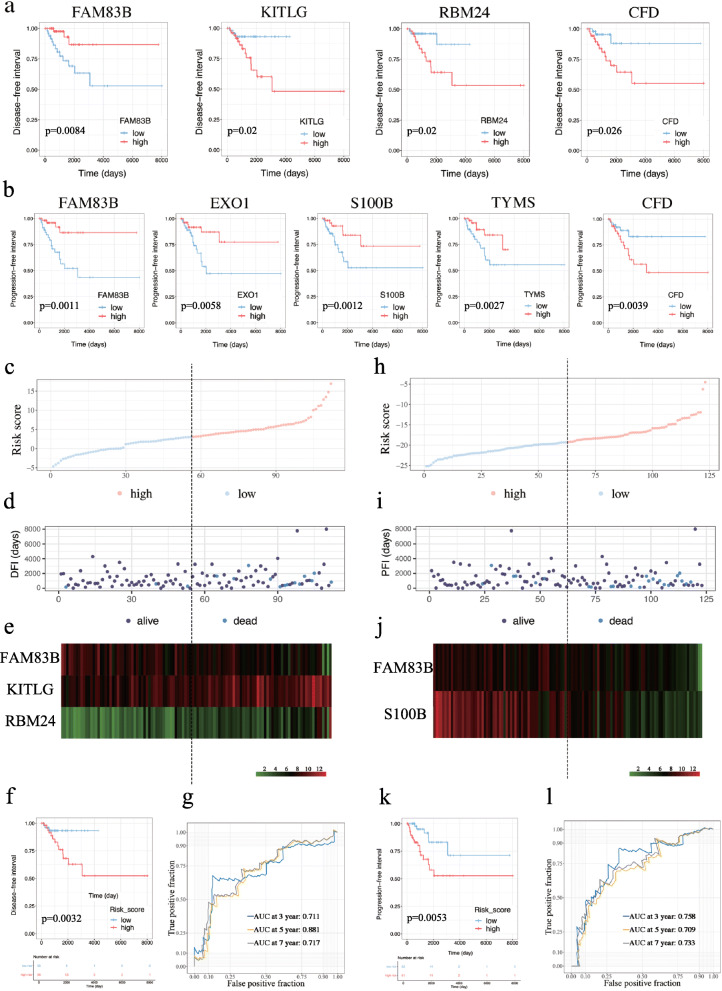
Fig. 5.
The result of Cox regression analysis of TNBC patients in the DFI and PFI models. a Kaplan-Meier curves of analysis of DFI for FAM83B, KITLG, RBM24 and CFD. b Kaplan-Meier curves of PFI for FAM83B, EXO1, S100B, TYMS and CFD. c Volcano plot of risk score of high and low risk TNBC patients in the DFI model. d Scatter plot of survival status and time of TNBC patients in the DFI model. e Expression of FAM83B, KITLG and RBM24 in high-risk and low-risk groups in the DFI model. f Kaplan-Meier curve for DFI in low-risk and high-risk groups. g 3-year, 5-year and 7-year time-dependent ROC curves of the DFI model. h Volcano plot of risk score of TNBC patients in the PFI model. i Scatter plot of survival status and time of TNBC patients in the PFI model. j Expression of FAM83B and S100B in high-risk and low-risk groups in the PFI model. k Kaplan-Meier curve for PFI in low-risk and high-risk groups. l Time-dependent ROC for 3-year, 5-year and 7-year PFI in TNBC patients 3-year, 5-year and 7-year time-dependent ROC curves of the PFI model

