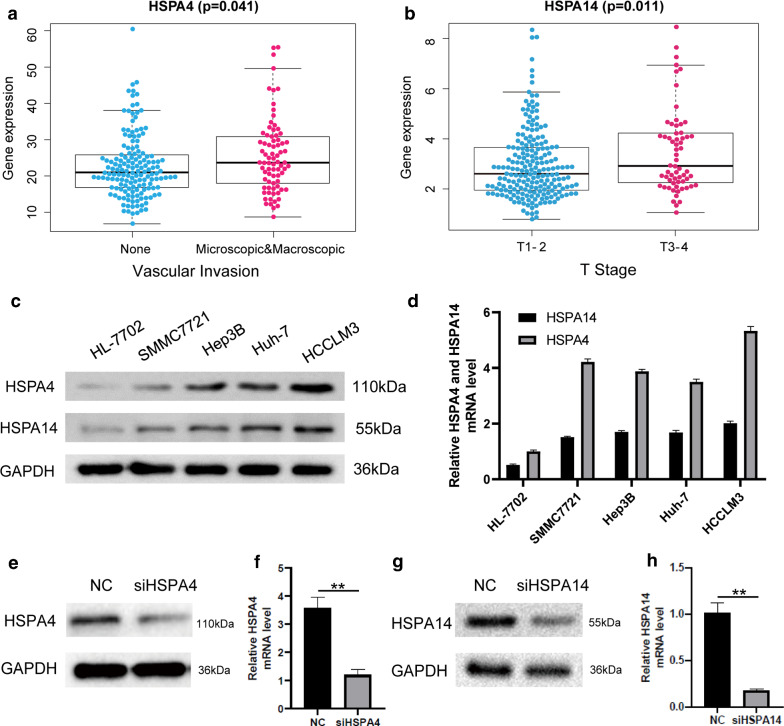
Fig. 8.
Expression of HSPA4 and HSPA14 in normal liver cells and HCC cells. A The expression of HSPA4 was positively correlated with vascular invasion. B The expression level of HSPA14 was positively correlated with higher T stage. C and D The results of Western Blot and qPCR revealed that HCCLM3 cells demonstrate relatively high levels of HSPA4 and HSPA14 expression. E and F The expression of HSPA4 in siHSPA4 is less than that in NC group, and the expression of HSPA14 was less than that in NC group(p < 0.01), the NC group was the negative control group

