. 2021 Apr 6;299(3):703–711. doi: 10.1148/radiol.2021203959

Figure 4:

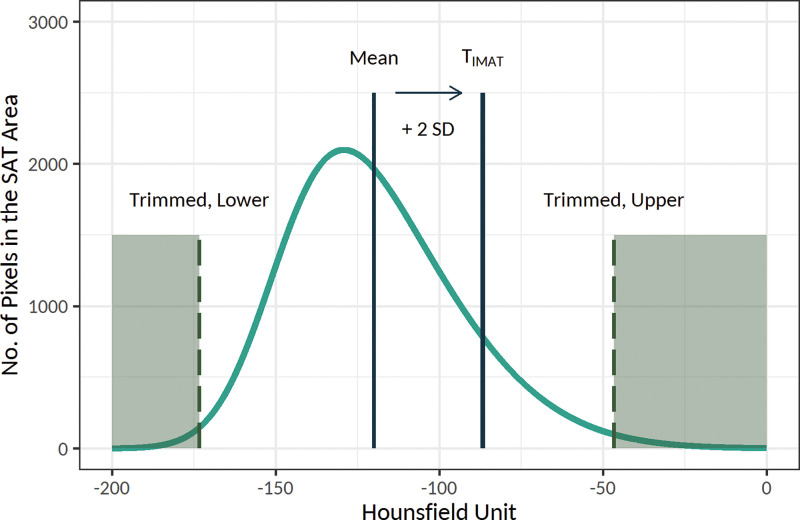
Schematic presentation of the threshold for the intramuscular adipose tissue (IMAT), or TIMAT, calculation method. Histogram of the attenuation of the subcutaneous adipose tissue (SAT) area was used to determine the individualized threshold for the IMAT (the figure is schematic and not to scale). In this method, after trimming the lower and upper 30% of values, the threshold for the IMAT was calculated as mean + 2 × standard deviation (SD) of the attenuation of the remaining pixels. The IMAT within pectoralis muscle was defined as the summated areas of pixels with attenuation below the threshold for the IMAT.

Schematic presentation of the threshold for the intramuscular adipose tissue (IMAT), or TIMAT, calculation method. Histogram of the attenuation of the subcutaneous adipose tissue (SAT) area was used to determine the individualized threshold for the IMAT (the figure is schematic and not to scale). In this method, after trimming the lower and upper 30% of values, the threshold for the IMAT was calculated as mean + 2 × standard deviation (SD) of the attenuation of the remaining pixels. The IMAT within pectoralis muscle was defined as the summated areas of pixels with attenuation below the threshold for the IMAT.