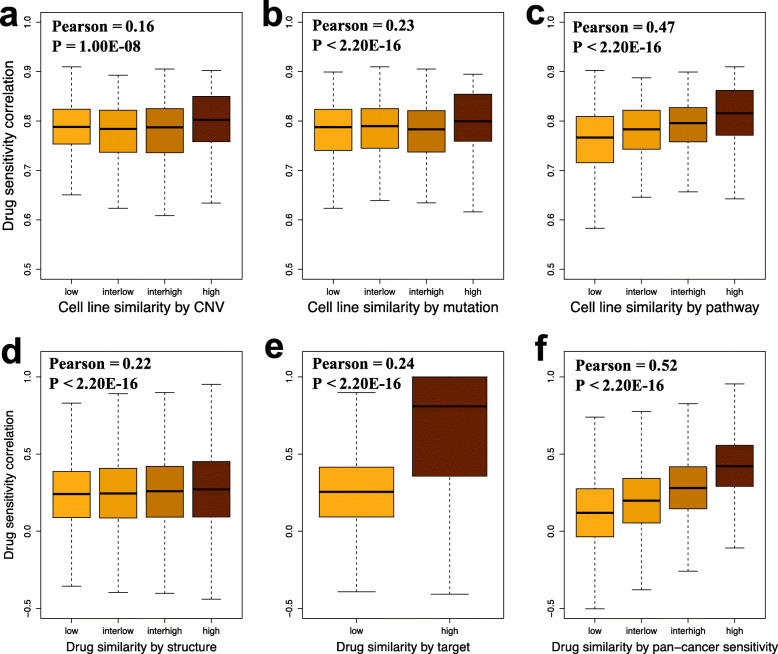
Fig. 2.
Similar cell lines and similar drugs have similar responses. a, b, and c Box plots show that cell lines with similar CNV (a), mutation (b), and pathway activity (c) profiles respond similarly to the same drugs. The X-axis indicates the similarity level between all possible BC cell line pairs. We divided the similarity level between two cell lines into “low” (minimum <= ρ(C, Ci) < 1st quantile), “interlow” (1st quantile <= ρ(C, Ci) < median), “interhigh” (median < = ρ(C, Ci) < 3rd quantile) and “high” (3rd quantile <= cc < maximum) based on CNV (a), mutation (b), and pathway activity (c) correlations. The y-axis shows the correlations of their drug response vectors as measured by IC50. d, c, e Box plots show that drugs with similar structure (d), targets (e), and pan-cancer cell line sensitivity (f) profiles have similar effects on BC cell lines. The drug pairs were separated into “low” (minimum <= ρ(D, Dj) < 1st quantile), “interlow” (1st quantile <= ρ(D, Dj) < median), “interhigh” (median < = ρ(D, Dj) < 3rd quantile) and “high” (3rd quantile <= ρ(D, Dj) < maximum) groups based on the correlations of structure (a) and pan-cancer cell line sensitivity (c) profiles. Drug pairs were divided into “low” (ρtarg(D, Dj) <= 0) and “high” (ρtarg(D, Dj) > 0) groups using their target correlations. The Y-axis shows the correlations of their sensitivity vectors tested in BC cell lines as measured by IC50

