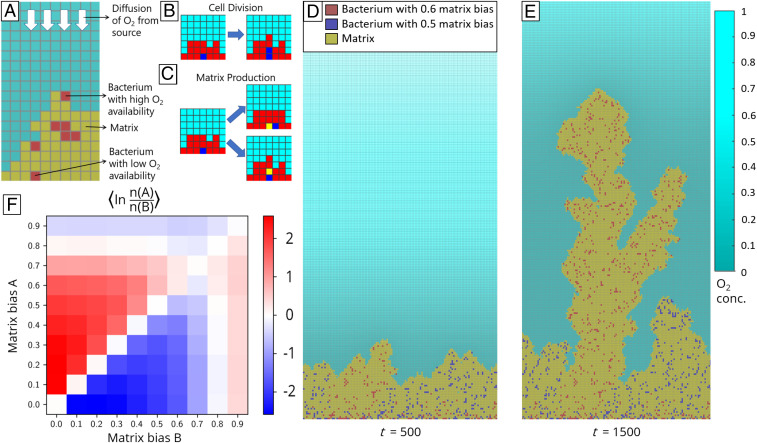
Fig. 1.
Simulated competitions of matrix-producing biofilms that grow on a submerged surface toward an source. For details see Materials and Methods and SI Appendix. (A) All simulations are performed on a two-dimensional square lattice of width 128 sites and height 256 sites. Red squares are bacterial cells, yellow squares are extracellular matrix, and cyan squares are unoccupied. White arrows indicate diffusion of from above. (B and C) Schematic of cell division and matrix production, shown for a blue cell surrounded by red cells. Cell division results in an identical cell’s being placed in an adjacent site. If no adjacent site is available, cells are shoved out of the way to make room for the new cell. Similarly, matrix production results in filling of an adjacent site with matrix. (D) Snapshot of a pairwise competition after 500 simulation timesteps. Red cells have matrix bias of 0.6 while blue cells have matrix bias of 0.5. Shade of cyan squares indicates normalized concentration (normalized by the highest concentration recorded for the entire simulation). (E) Snapshot of the same competition in C after 1,500 timesteps. (F) Mean of the natural logarithm of the final ratio of number of cells with matrix bias A to number of cells with matrix bias B. Between 75 and 350 simulations were performed for each competition.

