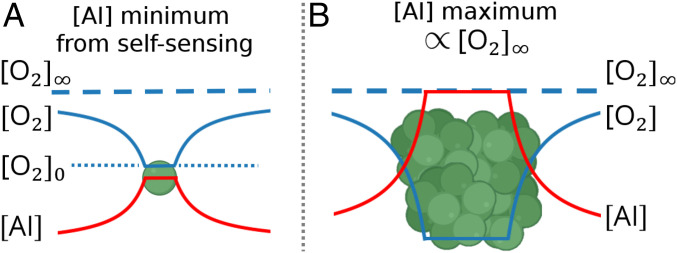
Fig. 4.
Schematic illustrating the limited DR of AI concentrations. (A) A single bacterial cell, consuming oxygen and secreting AI. The AI concentration in the vicinity of the cell is proportional to the difference between the concentration at infinity, , and the concentration in the vicinity of the cell, . (B) A bacterial colony, consuming and secreting AI. If the concentration inside the colony is close to zero, the AI concentration approaches a maximum value . This relation between the AI concentration and concentration leads to the upper limit on the DR of AI described in Eqs. 2–4.

