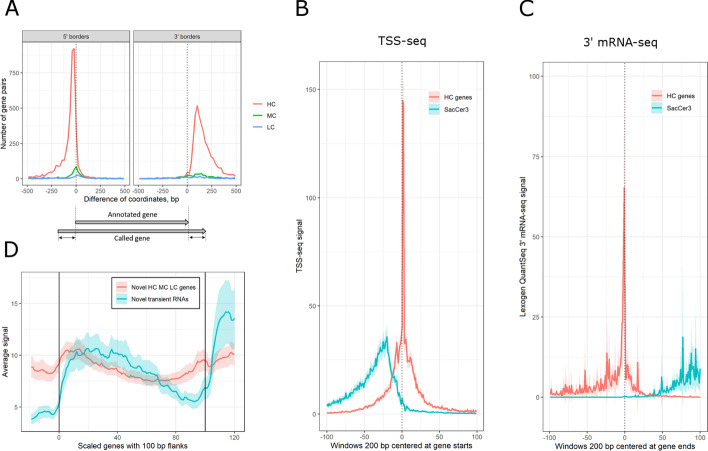
Fig. 5.
Comparison of called yeast genes to SacCer3. A Distribution of differences between 5' or 3' borders (left and right panels, respectively) of the matched gene pairs. Y axis shows the number of gene pairs, X axis shows the difference of genomic coordinates (in bp). A negative (positive) difference value means that the border of the called gene is located upstream (downstream) from the respective border of its mate in SacCer3. B Metagene profile of TSS-seq signal over 5' gene borders on matched HC/SacCer3 gene pairs. Fixed length genomic intervals (200 bp) were centered on the 5' gene borders predicted by either TranscriptomeReconstructoR or SacCer3. Y axis shows the average sequencing coverage of TSS-seq, X axis shows the genomic coordinates relative to the 5' gene border (zero corresponds to the predicted gene start). Color of the wiggle line indicates the origin of the genomic windows: blue for SacCer3 and red for the called HC genes. C Metagene profile of 3' mRNA-seq signal over 3' gene borders on matched HC/SacCer3 gene pairs. D Metagene plot of NET-seq signal over the whole bodies of novel HC, MC and LC genes and novel transient RNAs. The genes were scaled to 100 bins. The 100 bp upstream and downstream flanking regions were scaled to 20 bins each. The vertical lines in the plotting area denote the starts and ends of novel genes. Red and blue wiggle lines show the average RNAPII elongation activity in novel genes and transient RNAs, respectively. Red and blue shaded areas show normal-bases 95% confidence interval for the respective means

