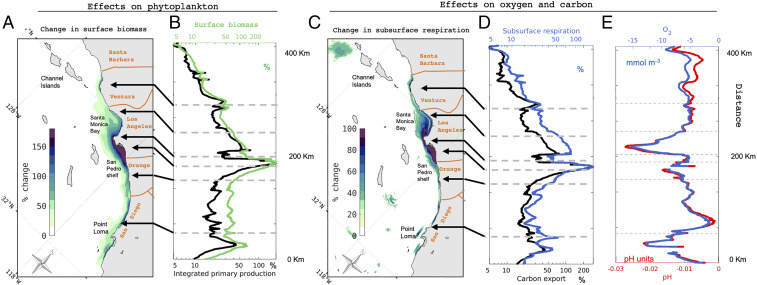
Fig. 3.
Biogeochemical effects of land-based and atmospheric nutrient inputs in the SCB. (A) Surface chlorophyll enhancement (%) in the ANTH simulation, relative to the CTRL simulation. (B) Alongshore surface chlorophyll (green line) and vertically integrated net primary production (0 to 80 m, black line) enhancement (%). (C) Subsurface (40 to 80 m) respiration enhancement (%). (D) Alongshore subsurface (40 to 80 m) respiration and carbon export enhancement (%). (E) Absolute alongshore (mmol ; blue line) and pH (seawater scale; red line) changes at 50-m depth. Values show spring and summer averages between January 1997 and December 2000. Alongshore values are the averages between the coast and 15 km offshore. Note the nonlinear x axis in B and D. Names of counties and their boundaries are labeled in orange in A and C.

