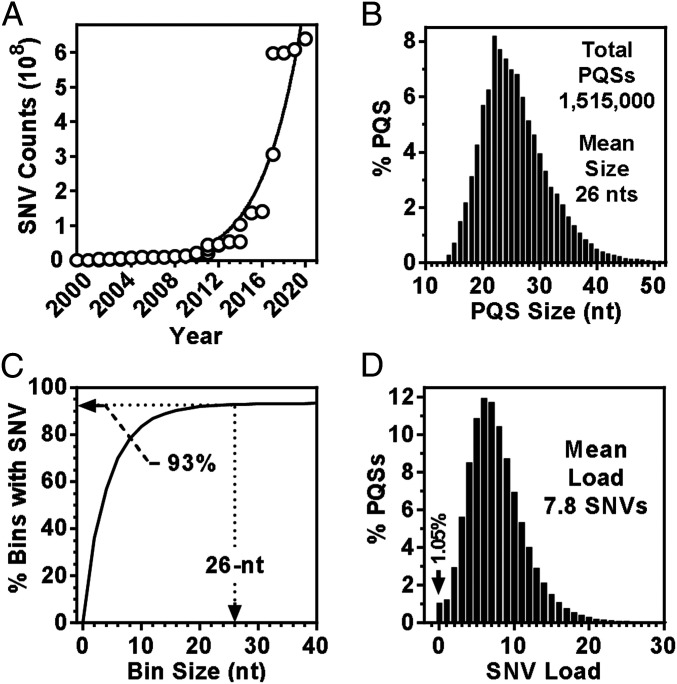
Fig. 2.
SNVs and PQSs in the human genome. (A) Accumulation of SNVs in the NCBI dbSNP database over the last decade. (B) The size distribution of PQS motifs. (C) SNV coverage across intervals of chromosomes. Arrow indicates the probability of finding at least one SNV in a 26-nt-sequence motif. (D) Distribution of SNV loads in PQSs.

