Fig. 2.
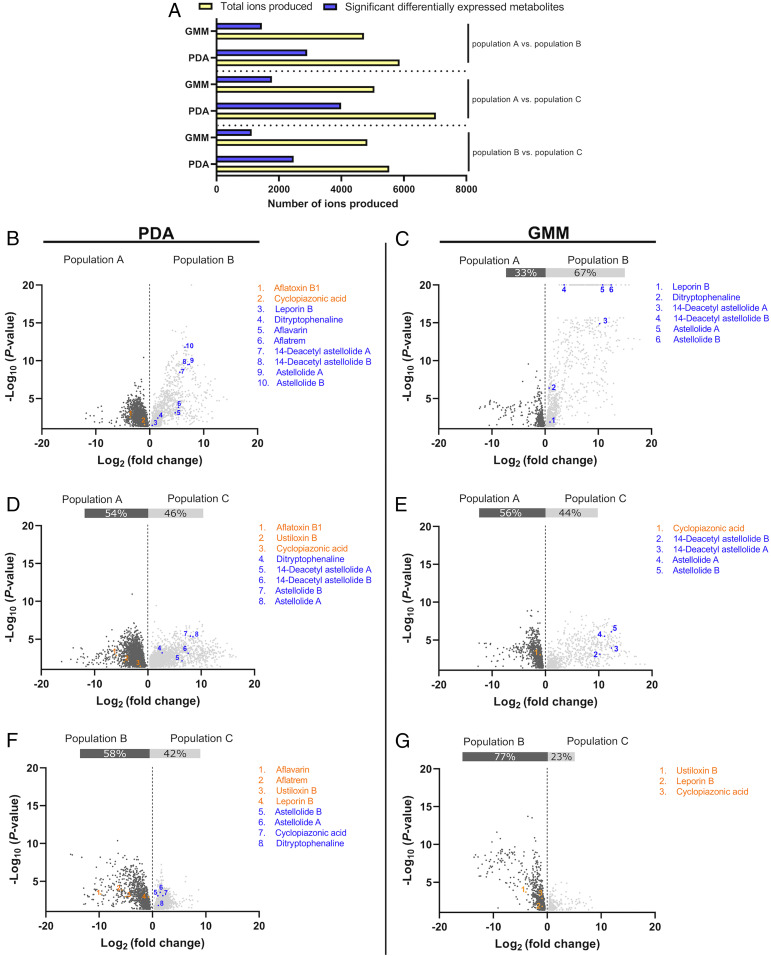
Production of metabolites by A. flavus isolates of populations A, B, and C [identified previously (27)] grown on PDA and GMM as detected by ultra-high-performance liquid chromatography–high-resolution mass spectrometry in positive mode. Ions showing significant differences (P < 0.05) in pairwise comparison of populations were assumed to be metabolites and are referred to as significantly differentially expressed metabolites (SDEMs) (A). The magnitude and significance of SDEMs for each pairwise comparison are depicted in volcano plots for PDA (B, D, and F) and GMM (C, E, and G). Putative SMs are colored blue or orange to differentiate from unidentified metabolites, which are colored gray or dark gray. Points within each volcano plot were colored orange or dark gray if they were produced in higher abundance by the first-named population and blue or gray if produced in higher abundance by the second-named population. The identity of SMs was confirmed by fragmentation analysis (SI Appendix, SI Text).

