. 2021 Jan 20;3(3):e200165. doi: 10.1148/ryai.2021200165

Figure 4:

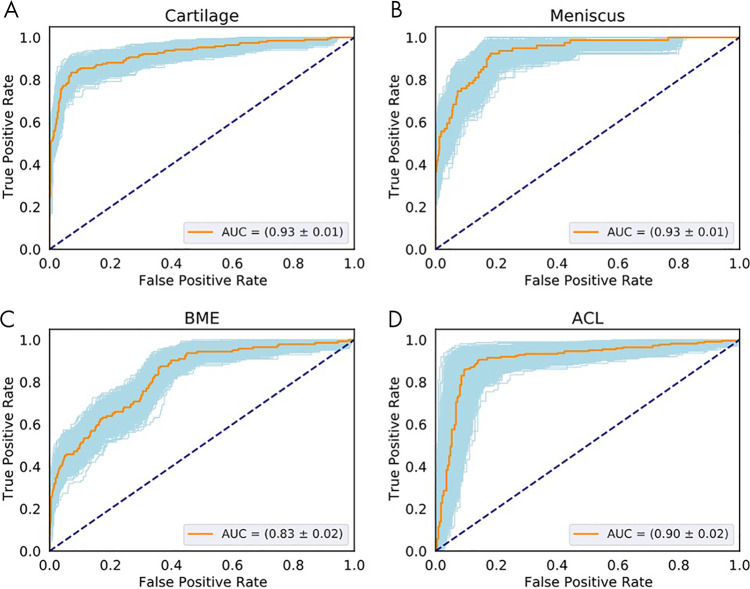
Receiver operating characteristic (ROC) curves show the diagnostic performance of cartilage, meniscus, and bone marrow edema (BME) lesion detection in the full-knee lesion-assessment proposal. Orange lines represent the average ROC curves. Blue shaded areas represent the ROC curves with areas under the ROC curve (AUCs) within 1 standard deviation of the mean after bootstrapping 1000 times. Dashed diagonal lines represent an AUC equal to 0.5. ROC curves and AUCs are shown for the detection of lesions within, A, cartilage, B, meniscus, C, BME and for D, anterior cruciate ligament (ACL).

Receiver operating characteristic (ROC) curves show the diagnostic performance of cartilage, meniscus, and bone marrow edema (BME) lesion detection in the full-knee lesion-assessment proposal. Orange lines represent the average ROC curves. Blue shaded areas represent the ROC curves with areas under the ROC curve (AUCs) within 1 standard deviation of the mean after bootstrapping 1000 times. Dashed diagonal lines represent an AUC equal to 0.5. ROC curves and AUCs are shown for the detection of lesions within, A, cartilage, B, meniscus, C, BME and for D, anterior cruciate ligament (ACL).