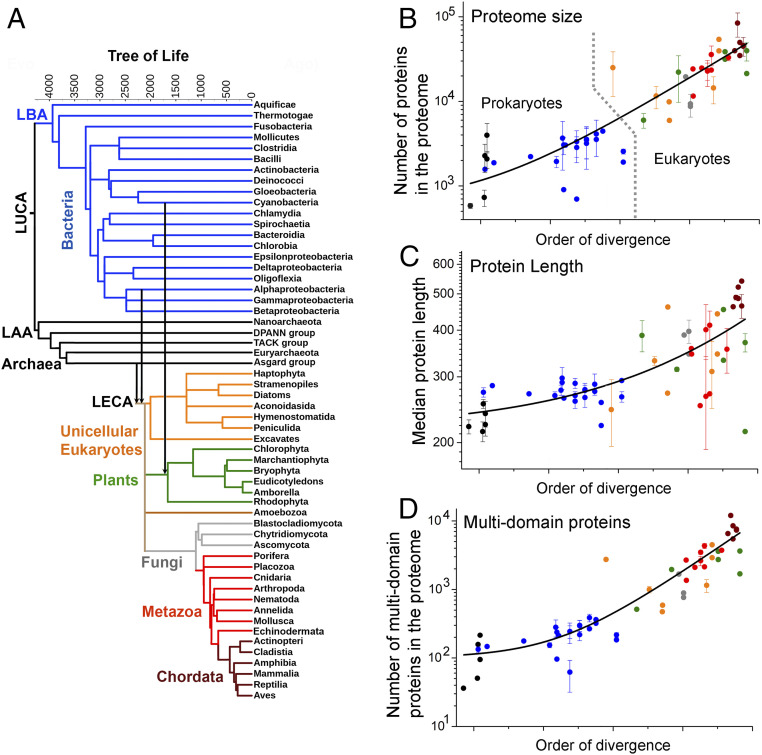
Fig. 1.
Expansion of proteome size across the Tree of Life. (A) The ToL used in this study. Leaves represent extant phylogenetic clades, while internal nodes represent their presumed ancestors. Branch lengths are in million years, as available from TimeTree (19), and they refer to the relative order of divergence of the corresponding clades rather than the absolute dates of their emergence. The major phylogenetic groups in the tree (Bacteria, Archaea, unicellular eukaryotes, plants, Fungi, Metazoa, and Chordata) are highlighted in different colors. Vertical arrows highlight the two major endosymbiosis events: the Alphaproteobacterial origin of mitochondria and the cyanobacterial origin of plastids. LAA, last archaeal ancestor; LBA, last bacterial ancestor. (B–D) The average per-clade values for various proteome size parameters (y axis, in log scale) are plotted against their order of divergence (along the x axis in linear scale). These parameters include proteome size (B), median protein length (C), and multidomain proteins in the proteome (D). In these scatterplots, the colors of data points represent their major phylogenetic group in the tree (A). Error bars represent the clade SD (no error bars relate to clades comprising only one representative organism). The lines were derived by a fit to an exponential equation, and are provided merely as visual guides. Prokaryotic and eukaryotic organisms are separated by a dashed line in B.

