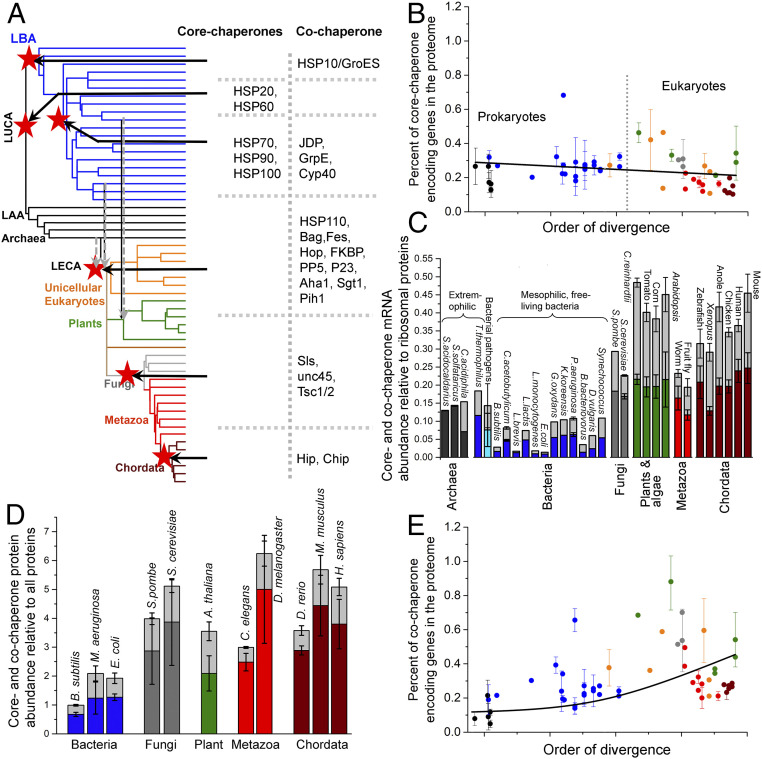
Fig. 3.
Evolutionary history of core and cochaperones. (A) The de novo emergence of core- and cochaperone families is summarized on the ToL. The ToL is the same as in Fig. 1A; clade names are omitted for clarity. Ancestral nodes in which a chaperone family emerged are marked with red stars and the core- and cochaperone families emerged in that node are listed. The dashed gray arrows reflect the endosymbiotic integration of archaeal and bacterial chaperone systems in LECA and eukaryotic and cyanobacterial chaperone systems in photosynthetic algae. (B) The percentage of core-chaperone genes per proteome (shown is the average percentage for each phylogenetic clade). Figure features follow Fig. 1. The line was derived by a fit to a linear equation and is provided merely as a visual guide. Prokaryotic (black and blue dots) and eukaryotic organisms (orange, gray, green, red, and wine dots) are largely separated by a dashed line. (C) Core- and cochaperone gene expression, relative to ribosomal proteins, in cells. Plotted are model organisms for which sufficient, processed, and reliable expression data were available. The columns include core chaperones (colors represent the phylogenetic clades in Fig. 1A) and cochaperones (light gray color). The error bars represent the SD among different nonredundant abundance datasets. (D) Same as C, for the relative basal abundance of core and cochaperones in cells. (E) Same as B, for cochaperone genes per proteome. The line was derived by a fit to an exponential equation and is provided merely as a visual guide.

