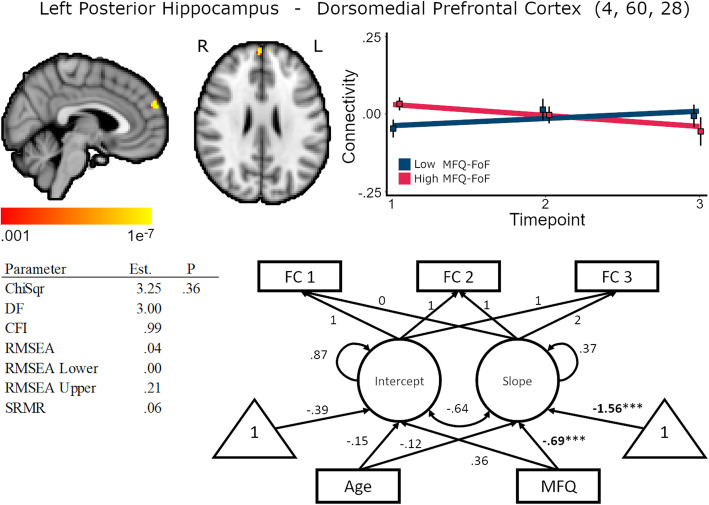
Fig. 3.
Baseline MFQ-FoF predicted decreasing connectivity between the left hippocampus and dorsomedial prefrontal cortex, 248 mm3 cluster size. Brain image cluster gradients reflect p values between .001 and 1e−7. Fit lines for FC trajectory based on median split of MFQ-FoF values with the red reflecting the mean trajectory for older adults with a greater degree of SCD at baseline and blue reflecting individuals with fewer baseline concerns. This median split was only for visualization and is not reflected in the structural equation models. Model fit and parameter estimates are for the peak voxel

