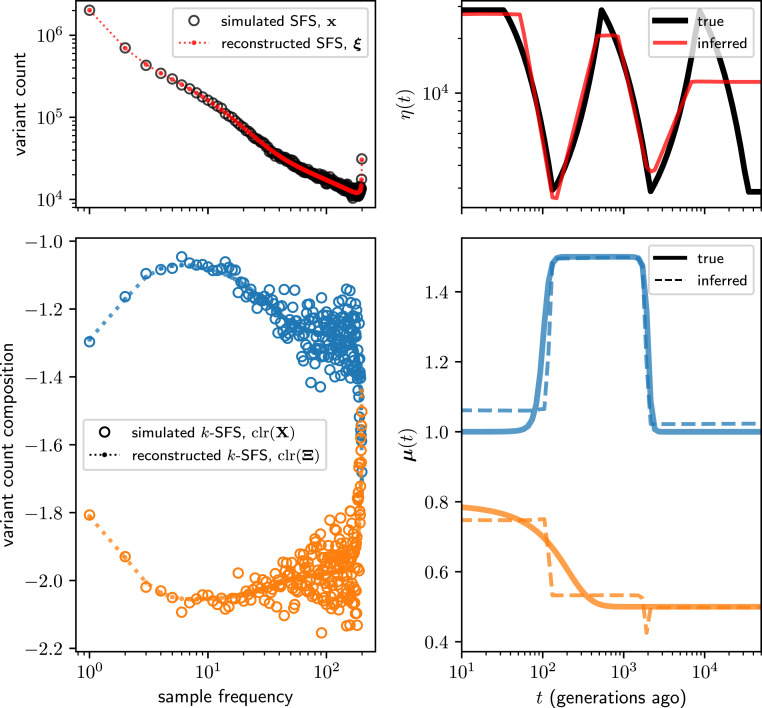
Fig. 1.
Simulation study of mushi performance. The sawtooth demography (Upper Right) and a MuSH with 96 mutation types (Lower Right; with two nonconstant components shown) were used to simulate 3-SFS data for sampled haplotypes. The MuSH has a total mutation rate of about , generating about 9.5 million segregating variants. Upper Left shows the SFS, and Lower Left shows the two variable components of the -SFS as a composition among mutation types at each allele frequency. Time was discretized with a logarithmic grid of 100 points. Inference was performed using a mixture of order 0 and order 1 trends for demography, and order 0 trends for MuSH (Materials and Methods and SI Appendix, Figs. S1 and S2).

