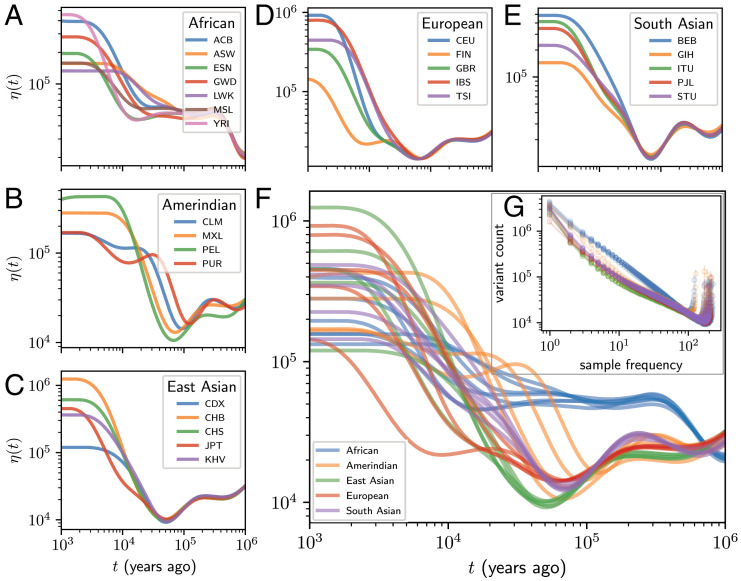
Fig. 2.
Effective population size histories estimated from high-coverage 1KG data. (A–E) Estimated demographic history for all populations grouped by continental ancestry. Inference was performed using a mixture of order 0 and order 3 trends (Materials and Methods and SI Appendix, Fig. S6). African populations: African Caribbeans in Barbados (ACB); Americans of African ancestry from the southwestern United States (ASW); Esan in Nigeria (ESN); Gambian in western divisions in the Gambia (GWD); Luhya in Webuye, Kenya (LWK); Mende in Sierra Leone (MSL); and Yoruba in Ibadan, Nigeria (YRI). Amerindian populations: Colombians from Medellin (CLM); Mexican ancestry from Los Angeles (MXL); Peruvians from Lima (PEL); and Puerto Rican (PUR). East Asian populations: Chinese Dai in Xishuangbanna (CDX); Han Chinese from Beijing (CHB); Han Chinese from Shanghai (CHS); Japanese from Tokyo (JPT); and Kinh in Ho Chi Minh City (KHV). European populations: Utah residents with Northern and Western European ancestry (CEU); Finnish in FIN; British in England and Scotland (GBR); Iberian population in Spain (IBS); and Toscani in Italia (TSI). South Asian populations: Bengali from Bangladesh (BEB); Gujarati Indian from Houston (GIH); Indian Telugu from the United Kingdom (ITU); Punjabi from Lahore (PJL); and Sri Lankan Tamil from the United Kingdom (STU). (F) The same estimates on common axes to allow comparison of superpopulations. (G) SFS data (open circles) for all populations grouped by continental ancestry, as well as fits based on the expected SFS from the estimated demographic history (points connected by lines).

