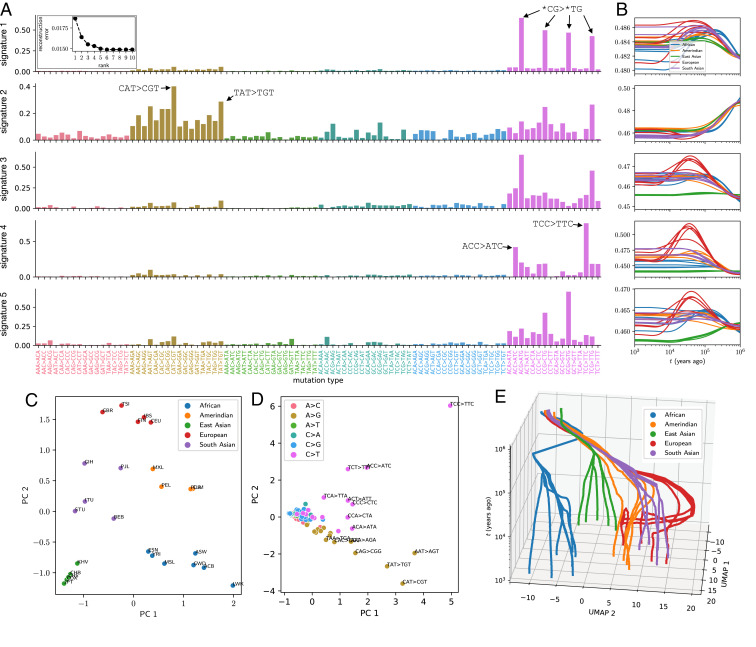
Fig. 4.
Decomposing MuSHs for 1KG populations into mutation signatures varying through time and between populations. (A) Triplet mutation signatures, shown as loading into triplet mutation types for each signature (rows). Inset shows tensor reconstruction error over a range of ranks for NNCP decomposition, indicating rank 5 as a good approximation. (B) Historical dynamics of each mutation signature’s intensity in each 1KG population (panels correspond to rows in A). SI Appendix, Fig. S10 shows the same intensity histories separately for each superpopulation. (C) Five-dimensional population factors projected to the first two principal components (PCs). (D) Five-dimensional mutation signature factors projected to the first two PCs. (E) UMAP embedding of mutation signature histories, initialized using the first two PCs of the time domain factors and then performed with default parameters.

