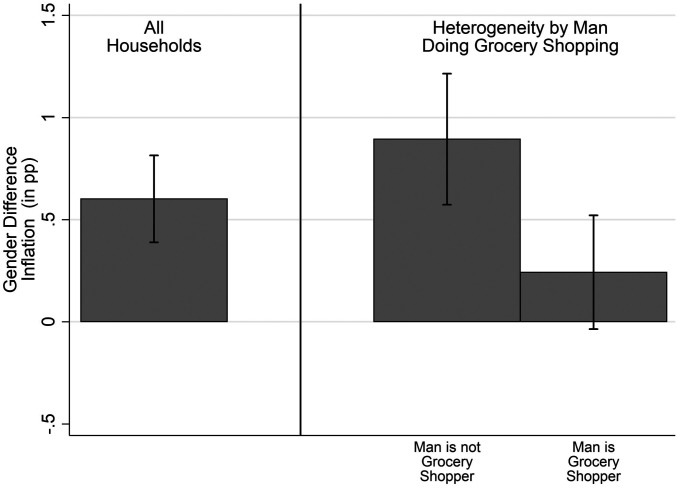
Fig. 1.
Gender expectations gap within households: raw data. Left bar plots the average differences in the inflation expectations of women and men within all households in the customized Chicago Booth Expectations and Attitudes Survey, which we fielded in June of 2015 and 2016. Center and Right bars split the sample based on whether men in the household take part in grocery shopping. Error bars indicate 95% confidence intervals obtained from standard errors clustered at the household level.

