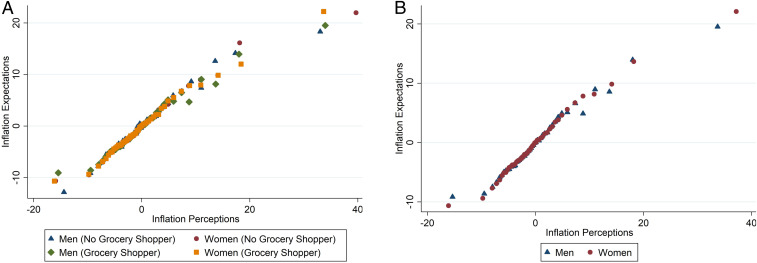
Fig. 5.
Mapping of perceptions into expectations by gender and grocery shopping. A is a binscatter plot mapping inflation perceptions into inflation expectations by gender and B also conditions on grocery-shopping behavior. Inflation perceptions and expectations are based on the customized Chicago Booth Expectations and Attitudes Survey, which we fielded in June of 2015 and 2016.

